Dr. Nicolas Robinson-Garcia discusses the results of the 2020 Responsible Metrics State of the Art Survey, which has been conducted every year since 2015.
With delay we are happy to report the findings of the 2020 Responsible Metrics State of the Art Survey. Being 2020 a difficult year for everyone, we do observe a decrease in participation with respect to 2019’s results going from 218 respondents to a total of 139 respondents. Still the diversity of countries from which respondents come from, already observed last year, is still evident (Figure 1). In this sense, it is remarkable to see the diligence and importance many professionals give to the survey and the time they take on doing so. Indeed we were happy to see comments on social media and receive emails reflecting the internal discussions that were taking place among colleagues while preparing their responses.

This year’s survey included some notable changes with respect to other editions. Along with the periodical questions related to the integration of responsible research metrics practices in their institution, we expanded the number of questions in two directions. First, we wanted to learn about the organization and department of the respondent in order to better contextualise their responses. Second, we asked specific questions about the tools they used when producing research metrics for their institutions.
76.3% of the respondents work at universities, followed by 14.4% who work at public research institutes. The remaining are scattered among other organizations, such as private companies (N=4), publishers (N=3) or hospitals (N=1) among others. From those working in academia, almost half of them (45.3%) work at the University Library, while 34.9% do so at the Research Office. The range of people working on research evaluation varies greatly from institutions, with a median of 4 people in libraries to 10 in Planning Offices or 5 in Research Offices and with wide differences within department types.
Sources and tools
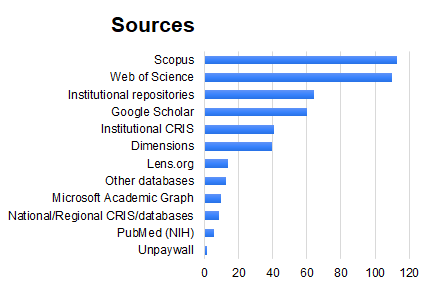
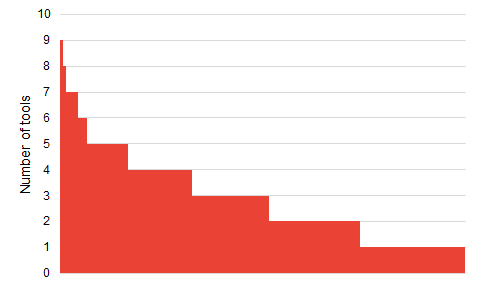
Regarding the sources and tools they use in their daily work, we included the most renowned bibliometric suites and databases, as well as an ‘other’ option in which respondents could add other tools they used to produce research metrics. Web of Science and Scopus are the most common data sources, followed by institutional repositories, Google Scholar and institutional CRIS systems. However, it is rare to use one single data source, and respondents indicate using on average more than three different data sources. Figure 3 shows the distribution of the number of sources used by respondents, ranging from 10 to 1.

The variety of tools and levels of sophistication shows great diversity also. Figure 4 gives an account of such diversity. Responses range from indicating the lack of use of bibliometric tools (N=11), to the use of commercial tools (Scival, InCites), to the combination of ad hoc tools with programming languages, visualization tools and bibliometric tools such as Bibibliometrix or BibExcel.

Again, responses reflect high versatility with tools rarely used in isolation (Figure 5), but always combining them in order to provide more fine-grained bibliometric analyses. This reflects the level of professionalism present in the field.
DORA signatories
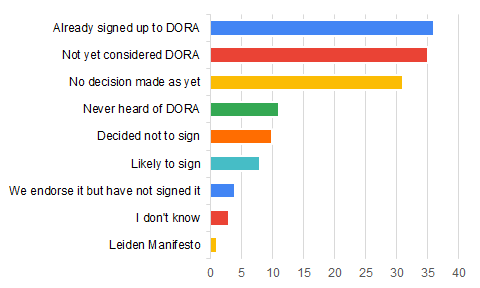
Compared to last years’ results, the share of respondents having signed DORA is higher than that of the ones who did not sign to DORA. This may be a result of a greater focus on DORA by Plan S, and a requirement by COAlition S funder, the Wellcome Trust, that grantees demonstrate a public commitment to the DORA principles. Among other comments we found a respondent who stated that their institution had regarded this decision as something that individuals, departments and faculties were free to do so, but which they would not do as a whole. We find also that DORA still has not reached everyone, and 11 respondents indicated they had never heard of it. 10 respondents indicated their institution had decided against signing it, while 4 claimed to endorse it but had decided not to sign it. In this sense, it remains to be seen whether public actions like the one recently taken against the University of Liverpool by the authors of the Leiden Manifesto and the Hong Kong principles, which is a signatory of DORA but did not reflect responsible research metrics practices, could have a consequence on these decisions.

Development of institutional principles
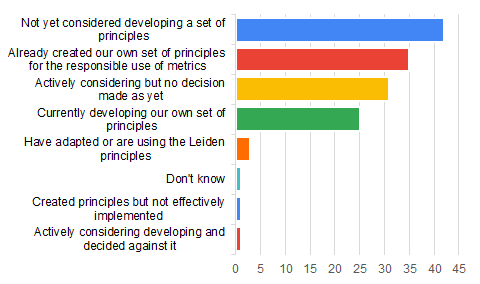
Almost 70% of respondents have at least considered the development of a set of principles on the responsible use of research metrics, an increase compared to the 52% reported in the 2019 survey (Figure 7). Of those, only one respondent indicated that their institution had decided against it. Respondents gave some notions on how these principles are being designed. In some cases they would use or adapt the principles set in the Leiden Manifesto to their institutional context, in other cases, they would actively participate in the development of national principles. In one case, a respondent indicated that they were working with INORMS to apply SCOPE to their responsible publishing framework.
Institutions in which publication-based indicators may not apply, are not exempt from the use of responsible metrics practices. An institution on Art & Design reported that they ‘do not use bibliometrics but are considering other metrics which relate more to departmental research performance rather than individual performance’. Others indicated that, despite not having an official set of principles, they did ‘actively consider the ethics of what we do’.

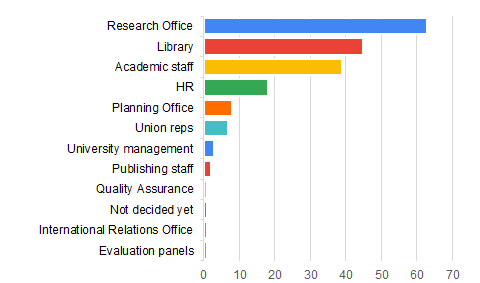
Departments responsible for developing such metrics are shown in Figure 8. These are normally the Research Office and the Library, although we see that academic staff also plays a role in decision making.
These principles followed those exposed in the Leiden Manifesto mainly, as well as DORA and other universities’ principles (Figure 9). However, respondents also reported using other documents such as the Hong Kong Manifesto, the Metric Tide, the Valencia Manual, the Panama Manifesto, other guidelines from the institution (e.g., Framework for Equity, Diversity and Inclusion or Strategy and Principles of Good Research Conduct), or national guidelines.

Implementation and effects
We finally asked respondents a series of open questions related to the implementation, reception and institutional effect of the introduction of principles on the use of responsible metrics.
In many institutions, the introduction of principles has been quite recent, not having as of yet much observed effects on daily practice. However, many respondents indicated that it has helped them in raising awareness about the use of metrics and self-assessing their own work. One respondent discussed how principles empowered professionals when asked to misuse metrics: ‘[it] enables us to say ‘no’ to requests for inappropriate analysis and to insist on transparency’. However, the lack of monitoring reported by many respondents on the use of responsible metrics can hamper perceptions on its effectiveness. Two respondents indicated that they had introduced a whistleblowing facility, while others included annual and bi-annual revision and monitoring.
Almost half of respondents (16 out of 35) indicated that the introduction of principles had been positively received. However, there were discussions on the difficulties of changing perceptions and practices in some fields, as well the way in which responsible practices are implemented:
‘In some areas very well; others are very entrenched in the use of unhelpful metrics and just revert to their “normal” ways every time.’
‘they like responsible evaluation and metrics in theory, but still look at indicators and rankings too much’
‘Generally positively in concept but remains skepticism as to how it translates to the ‘real world’’
Two thirds of the respondents indicate that their institution does not have a plan to implement a responsible metrics policy (21 out of 33). Although some institutions have introduced a highly detailed dissemination plan:
‘We have a plan divided in different phases of implementation. 1) Indicators creation and pilot study; 2) stabilization of indicators; 3) automatization of capture and visualization, workshops with decision-makers. Finally, we are addressing our exercise to build an internal CRIS.’
Still, they indicate benefits on the introduction of such policy, mentioning self-improvement, awareness and transparency, visibility within the institution, and improving institutional culture.
Conclusions
Following last year’s trend, we observe how we seem to have passed the phase of recognition and awareness of the need for a responsible use of metrics. Responses are becoming more critical with how such use is implemented and even negative views are motivated and well-argued, and not simply acknowledging ignorance. DORA adoption continues to increase but professionals indicate an ambivalent response from academic communities to these policies. Many of the malpractices surrounding the use of metrics seem to be quite entrenched in academic culture.
Regarding the introduction of new questions, we observe that the development of metrics requires an ever-more complex array of tools, both of general purpose as well as those specifically designed to produce research metrics. Interestingly, there is a widespread of data sources being used, including many of the new databases that have emerged in the last few years (e.g., Lens, Dimensions), showing that the days in which the professional community was tied to Web of Science are long gone.
In my view the most relevant take-away message is the fact that we are moving to a more complex discussion on how responsible metrics (or any other type of monitoring or evaluative approach) are implemented in practice and what do we actually mean by a responsible use. Here themes such as personalising and contextualising reports, dissemination and visibility, as well as metrics literacy seem to take on great importance, moving the conversation beyond the actual production of metrics to how these are reported, to whom and for what purpose.

Nicolas is a social scientist specialized in bibliometrics and research evaluation. He is a Ramón y Cajal fellow at the Information and Media department at the University of Granada. He is member of the Steering Committee of the European Summer School for Scientometrics and member of the editorial board of Scientometrics, Quantitative Science Studies and Frontiers Research Metrics & Analytics.
![]() Unless it states other wise, the content of the
Bibliomagician is licensed under a
Creative Commons Attribution 4.0 International License.
Unless it states other wise, the content of the
Bibliomagician is licensed under a
Creative Commons Attribution 4.0 International License.

4 Replies to “Results from the 2020 Responsible Metrics State of the Art Survey”