Jonathan Adams from Clarivate Analytics discusses how to responsibly use and interpret bibliometric data through a list of caveats and requirements prior to starting the planning of research evaluations.
Ensuring the responsible use of data about research activity has become an increasing problem over the last twenty years. As the owners and champions of the Web of Science™, previously the Science Citation Index, we at the ISI feel a significant degree of responsibility for its use. Of course, it isn’t just publication and citation data that are abused: research funding can equally be misinterpreted, oversimplified and wilfully corrupted.
Two years ago, we published a report, ‘Profiles, not metrics’ that set out to show how better visualizations could be made of the data that too frequently get boiled down into simplistic narratives of research ‘achievement’. Since then, we have continued our research into many other aspects of the Web of Science data; improved routes to analysis, offered possible slants on interpretation and more informative presentation of outcomes. Most recently, we published a summary paper, on Interpreting Bibliometric Data in Frontiers in Research Metrics and Analytics.
We realized that there are two interlinked problems regarding responsible research metrics. One is that academic analyses of the use of bibliometric data usually address only the technical aspects and fail to account for and appreciate user requirements, expectations, and actual practice. The other is that the employment of simplistic bibliometrics as researcher performance indicators is not only an abuse but a sorry undervaluation of what the data can really do for the user.
Bibliometric indicators are rarely the only evidence put before any user group. There may also be a rich range of preconceptions, assumptions, prejudices and political axes being ground. More generally, costs, time scales, national policy and competing interests will be either at the table or hovering nearby. Consequently, it is more important to consider how quantitative evaluation of research outcomes and opportunities can be made simple, transparent, and readily understood than it is to focus unduly on precision, accuracy, or scholarly notions of purity. For example, a picture of the distribution of citation impact values is more useful and informative to a research manager than an arcane discussion about whether the average value should be fractionally partitioned among authors and – if so – what complex formula is preferred.
In our paper we discuss how the reader’s interpretation of ‘performance’, which starts with a presentation using accurate but summative bibliometrics, should change when we start deconstructing the same data and then visualizing them in richer ways. From the perspective of a research manager with limited resources, investment decisions can easily go awry at governmental, funding program, and institutional levels. By exploring select real-life data samples we also show how the specific composition of each dataset can influence interpretive outcomes.
That leads us to a list of caveats and requirements that we see as obligatory considerations prior to starting the planning of any research evaluation let alone actually running it:
Normalization:
- How granular is your choice, for comparative purposes or to aggregate data across years and disciplines, of the broad or narrow focus to normalize citation counts against a global benchmark? An appropriate level of aggregation is essential and too narrow a view becomes self-referential.
- What categorical system for assigning journals and/or individual publications to discipline categories do you choose? There are many, each with a particular objective in design, and none is uniquely correct.
Collaboration:
- The balance of domestic and internationally co-authored publications in a portfolio is likely to influence the evaluation outcome. Be aware that papers with only domestic authors may be cited less often, but they are not necessarily less important.
- These diagrams show the proportions of citations (and citation impact, CNCI) each country gains from its single and multi-authored domestic papers and the international papers linked to one, two or more other countries. TH citation gain from international co-authorship can be seen for both countries. For the UK, the balance of papers is roughly proportional to the citation gains but, for Sri Lanka, there is a disproportionate citation gain from the multi-authored international papers.
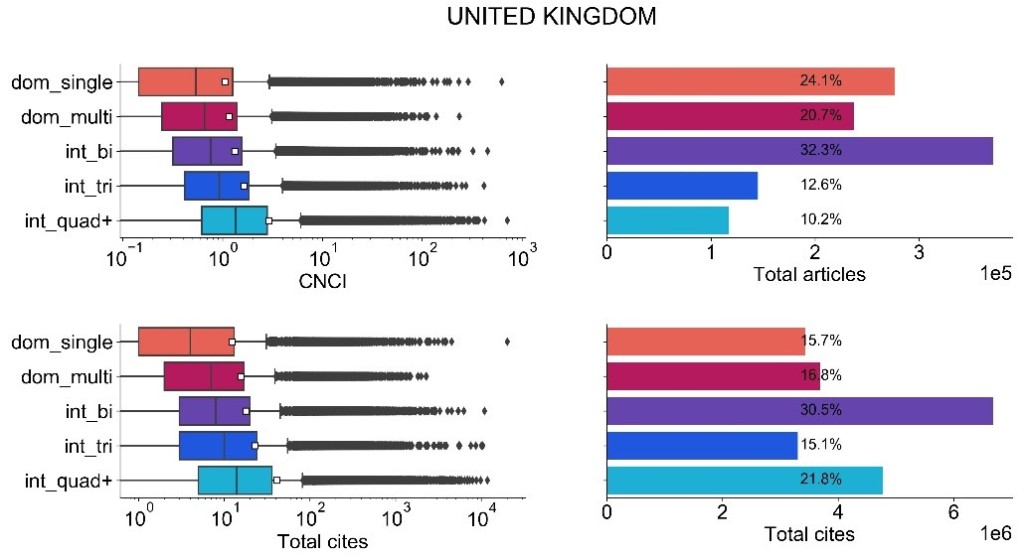
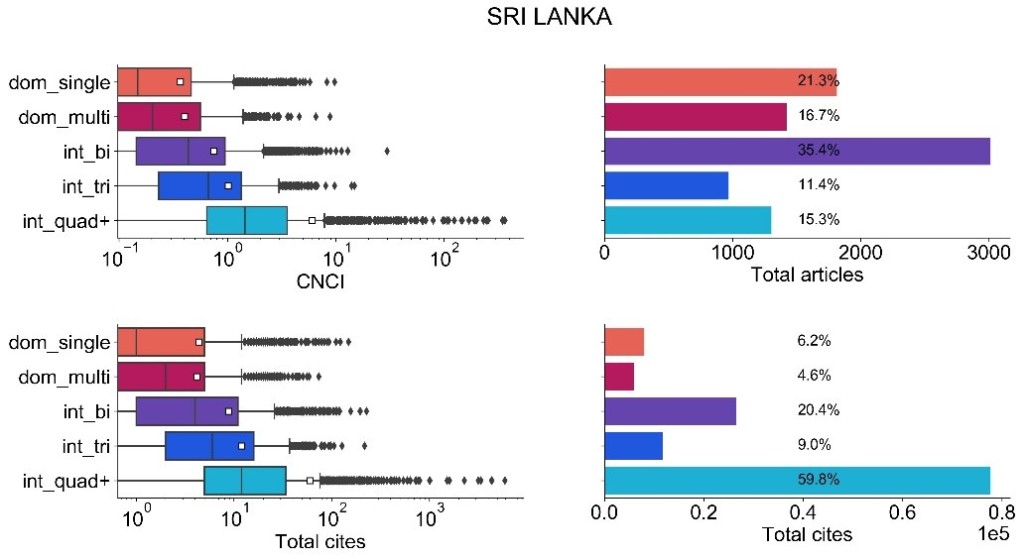
- Since internationally collaborative papers tend to have higher citation impact the evaluator must reflect on the extent to which the data are driven by the target of evaluation or by its work with its partners. Consider both the absolute and relative volume of international research collaboration.
- It is argued that partitioning of credit for output and impact should be used to account for collaborative influence, but there is no proof that arithmetic solutions deliver greater precision or accuracy and they are unlikely to assign the most appropriate fraction. Be conscious of the balance of author counts in the evaluated output and, if you choose to use it, be aware of the effects of fractional attribution.
History:
- There is a continuing, legacy influence of previous colonial relationships that is evident in analyzing international partnerships. Recognize the legacy of history and consider how this might influence outcomes.
Geography:
- Both distance and available networks affect collaboration opportunities. Not all countries are equal in their access to research partners (Denmark and New Zealand are small countries with great research but only one is in an EU network) and evaluators should consider whether location factors may favour or constrain the assessed activity.
Culture/language:
- There is a preference in some countries, sometimes stimulated by national Academies, to publish in nationally oriented journals. This is entirely appropriate but naturally reduces exposure to external researchers who focus on ‘international’ journals. The language balance should be understood in assessing output and any preference for journals with national rather than international orientation should be noted.
- There are known disciplinary differences in publishing and citing practice, but it is less commonly acknowledged that distinctions in research culture also occur between countries. Any evaluation should reflect on national and cultural components in data and indicators
Profiles:
- Visualizing the full Category Normalized Citation Impact (CNCI) distribution in an Impact Profile , which is now available in Clarivate’s InCites product, not only shows the true spread of strong and weak performance around the average but also exposes the difference between that average and the (always much lower) median (the 50th percentile).
Context:
- Most research indicators focus on a dataset for a target entity (country, institution, group) and the identification of research excellence. Research activity around the margins of that target – partners, peers, comparators, policy – and information in regard to other assessment criteria is less clear but it may be critical to interpretation and to the success of any intervention. Evaluators should consider that the research they assess is part of an ecosystem: the peak rests on a platform and the highly cited papers may depend on prior, less well-cited, work.
And finally beware of your benchmark: it is an apparent anomaly but mathematically possible that all nations can be above world average, which should throw further light on the interpretation of trajectories and achievements. Be sensitive to characteristics of the data and the analytical methods.
The basic challenge for scientometrics is not about additional, new indicators but about presenting the outcomes of sound academic research in metrics and analytics in a form that domain specialist users can make use of for evaluation within their field. We wholly endorse the views of Professor Henk Moed regarding the need for an evaluation framework in which the context and the purpose of the exercise are over-riding considerations.
Citations are themselves value-laden constructs with social as well as research weight. Any aggregation of citation counts, subsequent management of the data through normalization and fractionalization, and choice of analytical methodology then applied, must introduce further subjective modification that moves from original information towards a stylized indicator. In the end, expert, experienced informed judgment is the over-riding decision maker. Analytics should be supplement not substitute.
Further reading
Adams, J. (2013). The fourth age of research. Nature, 497, 557-560.
Adams, J. (2018). Information and misinformation in bibliometric time-trend analysis. Journal of Informetrics, 12, 1063-1071. https://doi.org/10.1016/j.joi.2018.08.009
Adams, J., Gurney, K.A. and Marshall, S. (2007). Profiling citation impact: a new methodology. Scientometrics, 72, 325-344
Aksnes, D.W., Langfeldt, L. and Wouters, P. (2019). Citations, citation indicators, and research quality: an overview of basic concepts and theories. Sage Open, published on-line February 7. https://doi.org/10.1177/2158244019829575
Bornmann, L. and Marewski, J.N. (2019). Heuristics as conceptual lens for understanding and studying the usage of bibliometrics in research evaluation. Scientometrics, 120(2), 419–459. https://doi.org/10.1007/s11192-019-03018-x
Bornmann, L. and Williams, R. (2020). An evaluation of percentile measures of citation impact, and a proposal for making them better. Scientometrics, 124, 1457–1478. https://doi.org/10.1007/s11192-020-03512-7
Evidence (2007). The use of bibliometrics to measure research quality in UK higher education institutions. Report to Universities UK. Universities UK, London. ISBN 978 1 84036 165 4 https://dera.ioe.ac.uk//26316/ (accessed 17 Sept 2020)
Ferretti, F., Guimaraes Pereira, A., Vertesy, D. and Hardeman, S. (2018). Research excellence indicators: time to reimagine the ‘making of’? Science and Public Policy, 45(5), 731–741. doi: 10.1093/scipol/scy007
Hicks, D. and Melkers, J. (2012). Bibliometrics as a Tool for Research Evaluation, pp 323-349, in, Handbook on the Theory and Practice of Program Evaluation, Link, A.N. and Vonortas, N.S. Edward Elgar, Oxford. Available at: http://works.bepress.com/diana_hicks/31/
Jappe, A., David Pithan, D. and Heinze, T. (2018). Does bibliometric research confer legitimacy to research assessment practice? A sociological study of reputational control, 1972-2016. PLoS One, published: June 14, 2018. https://doi.org/10.1371/journal.pone.0199031
Moed, H.F. (2020). How evaluative informetrics relates to scientific, socio-historical, political, ethical and personal values. Scholarly Assessment Reports, 2(1), p.9. http://doi.org/10.2904/sar.18
Nature. (2018). Science needs to redefine excellence: the concept of research excellence is ubiquitous, but its meaning depends on context (editorial). Nature, 554, 403-404. doi: 10.1038/d41586-018-02183-y
Pendlebury, D.A. (2020). When the data don’t mean what they say: Japan’s comparative underperformance in citation impact. Pp. 115-143 in, Evaluative Informetrics: The art of metrics-based research assessment. Festschrift in honour of Henk F. Moed. C. Daraio and W. Glänzel (Eds.). Springer Nature, Cham, Switzerland.
Potter, R., Szomszor, M. and Adams, J. (2020). Interpreting CNCIs on a country-scale: The effect of domestic and international collaboration type. Journal of Informetrics, 14(4),. https://doi.org/10.1016/j.joi.2020.101075
Rogers, G., Szomszor, M. and Adams. J. (2020). Sample size in bibliometrics. Scientometrics, 125, 777-794. DOI: 10.1007/s11192-020-03647-7
Sivertsen, G., Rousseau, R. and Zhang, L. (2019). Measuring scientific contributions with modified fractional counting. Journal of Informetrics, 13(2), 679-694. https://doi.org/10.1016/j.joi.2019.03.010
Waltman, L. (2016). A review of the literature on citation impact indicators. Journal of Informetrics,10, 365–391. DOI: 10.1016/j.joi.2016.02.007

Jonathan Adams is the Chief Scientist at the Institute for Scientific Information (ISI)™ at Clarivate. He is also a Visiting Professor at King’s College London, Policy Institute.
![]() Unless it states other wise, the content of the
Bibliomagician is licensed under a
Creative Commons Attribution 4.0 International License.
Unless it states other wise, the content of the
Bibliomagician is licensed under a
Creative Commons Attribution 4.0 International License.
